Graph 1.0 - Gerd Wagner
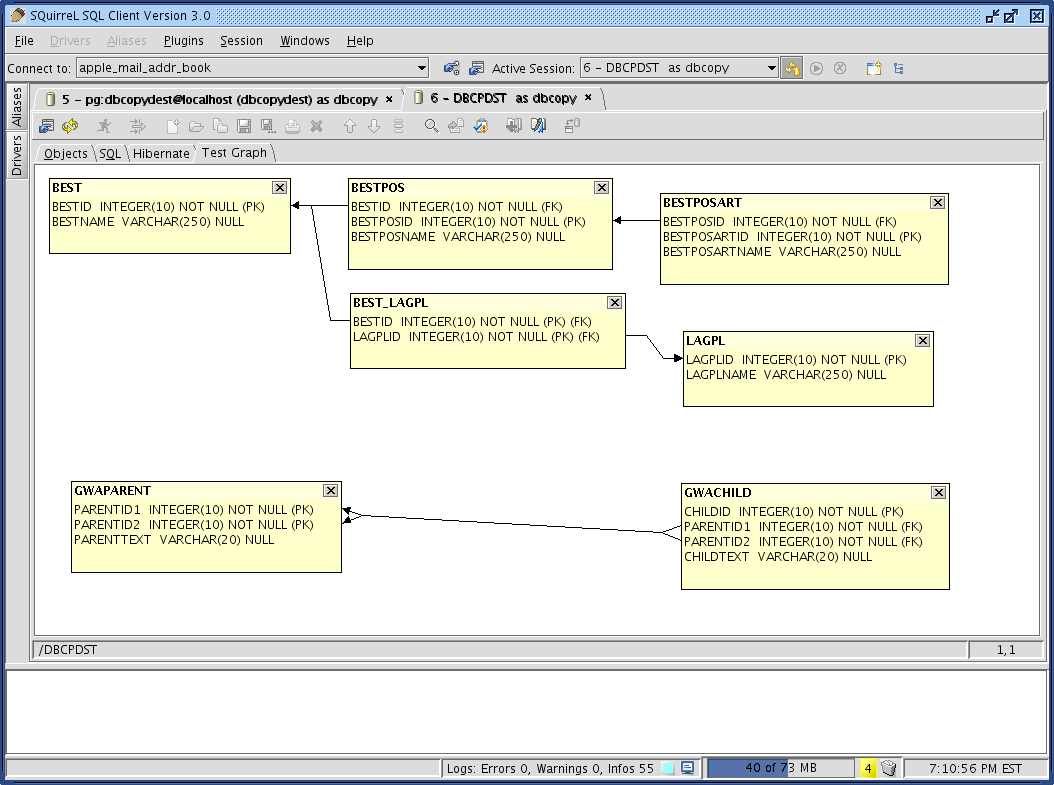
The Graph plugin allows to create charts of tables and foreign-key relationships.
To create a graph select the tables in the Object tree and click the 'Add to graph' item in the right mouse menu. Right mouse click tables, constraints as well as the background to find out what functions the Graph provides. To open a table a foreign key points to just double click on the foreign key column. The plugin supports browsing through the table structure. Note: A Graph uses foreign keys to render dependency lines between fields in the tables. So, a child column which is a member of a foreign key to a parent primary key column in a different table will be shown on the graph when both tables are added in such a way that the child column has a line with an arrow pointing to the parent column. So, if you want to have the graph plugin show relationships visually, you must - for the foreseeable future - define foreign keys using regular SQL in SQuirreL.
To distribute and print a graph to several sheets of paper click the 'Zoom/Print' item in the backgrounds right mouse menu. The control panel at the bottom of the Graph enables you to scale the chart as well as the paper edges.
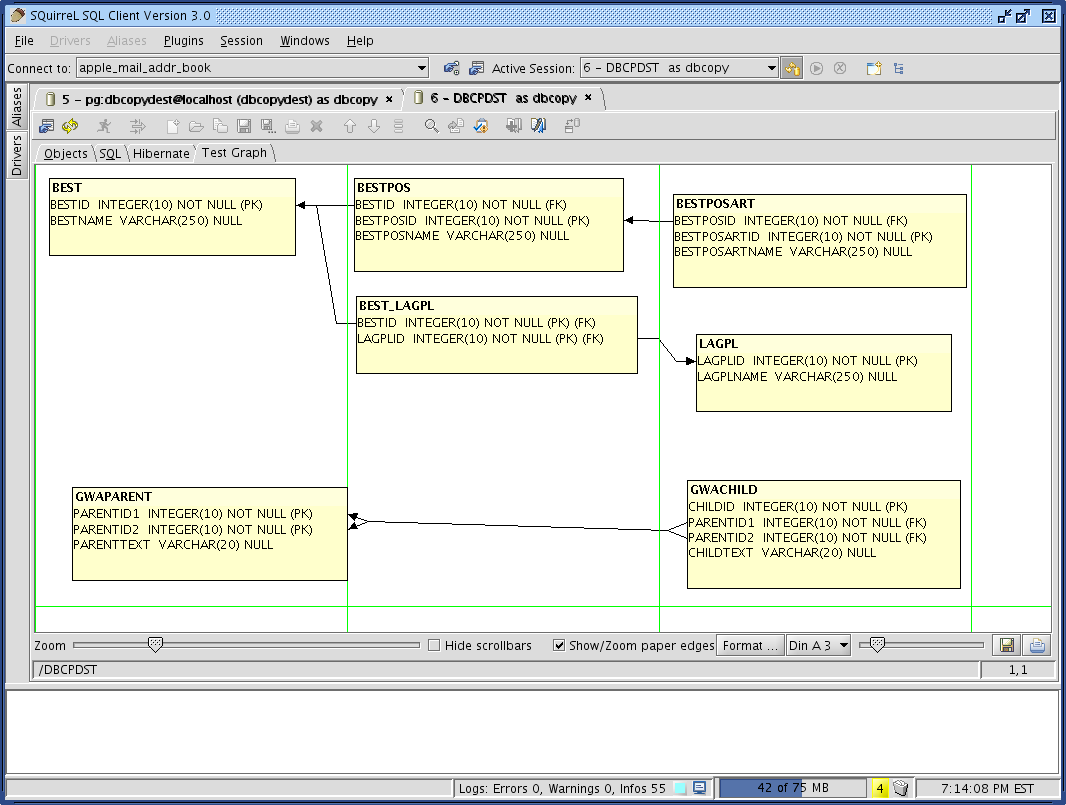
Note:
You can have several Graph tabs and you can give them meaningful names and save them. When the session is later re-opened, the previously saved graph tabs are restored.
The Graph plugin works best if you use the SQL Scripts plugin too. The SQL Scripts is available in the installer, or from within SQuirreL using the update feature.
Query Builder
The Graph Plugin provides a Query Builder. Besides the default and Zoom/Print modes described above Query Builder is a new mode of the Graph Plugin. The Query Builder brings along several enhancements:
The user can define constraint lines using drag and drop on columns with shift key down. User defined constraint lines are of blue color and can be right clicked to be configured or removed.
Multiple tables can be selected (ctrl key down) and moved simultaneously.
A Graph can be viewed in separate window.
Tables can be dragged from the Object tree to a Graph window. For convenience there is a new Session tool bar button that creates a new Graph window and places it right besides the Session's Object tree.
Graphs have a Kick off/Start button on the lower left of a Graph panel to give more intuitive access to Graph functions.